Cause and effect analysis is one of the most widely recognized methods used in quality management to understand why problems occur. Commonly associated with the Ishikawa or fishbone diagram, the method provides a structured way to examine how multiple factors may contribute to an undesired outcome.
Despite its familiarity, the method is often applied superficially. Many organizations treat it as a brainstorming exercise or a visual aid rather than a disciplined analytical step within corrective action. When this happens, the diagram becomes a list of opinions rather than evidence of systematic thinking.
Why structure matters more than the diagram
The effectiveness of cause and effect analysis is not determined by how the diagram looks, but by how it is used. Weak analyses typically share common traits: few causes listed, vague statements, conclusions embedded in the analysis, and no factual basis supporting why causes were identified.
A structured cause and effect analysis record addresses these weaknesses by fixing the logic of the analysis while leaving the content flexible. Instead of asking users to “fill in a diagram,” it requires them to evaluate cause categories deliberately and support each potential cause with objective information.
The tool you designed does exactly this by separating potential causes from evidence or basis, reinforcing disciplined thinking without prescribing conclusions.

Purpose of the cause and effect analysis record
The purpose of a cause and effect analysis record is not to determine the root cause. Its role is to document systematic evaluation of contributing factors prior to narrowing focus.
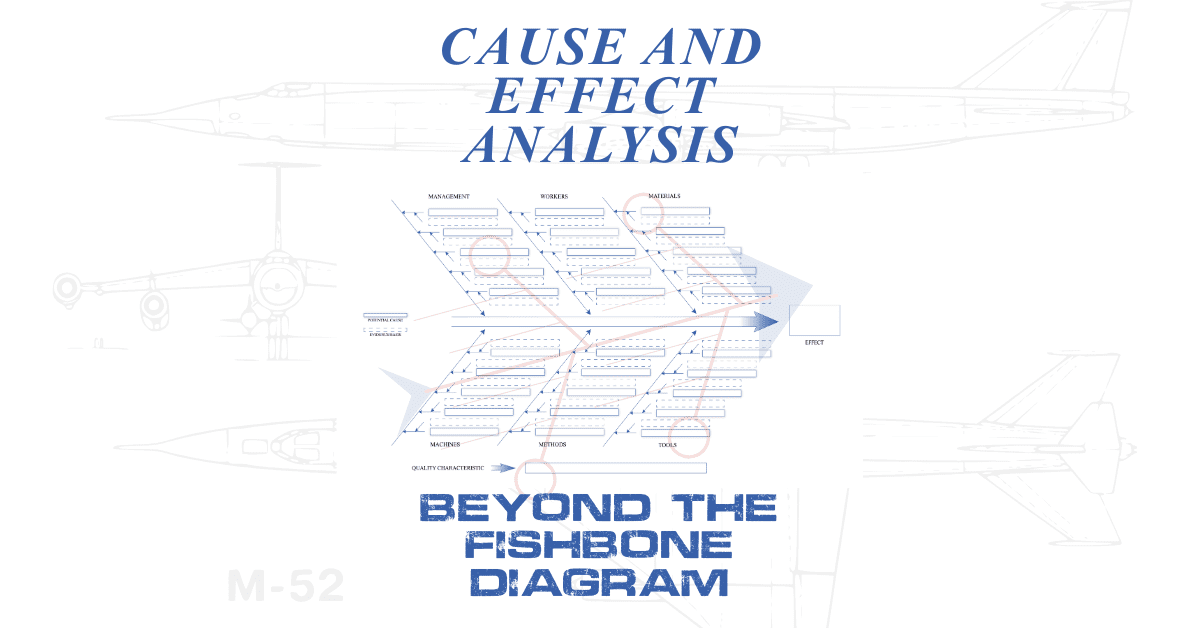
In your design, the effect is clearly defined as the observed problem or nonconformity. Cause families are fixed and complete, ensuring that management, people, materials, machines, methods, and tools are all considered. This prevents early narrowing and confirmation bias.
The inclusion of an affected quality characteristic further anchors the analysis to a defined requirement or attribute, reinforcing clarity without duplicating the problem statement.
Evidence-driven analysis rather than narrative
One of the strongest aspects of the tool is its insistence on evidence. By pairing each potential cause with a dedicated evidence or basis field, the analysis moves from opinion to fact.
This design choice directly addresses a common audit failure: causes listed without justification. It also discourages blame-based entries by requiring observable conditions or documented support.
The tool does not require that every cause be proven at this stage. It requires that each cause be reasonable and grounded.
Enforcing analytical depth without intimidation
Another frequent weakness in cause and effect analysis is shallow population. When only one or two causes appear across the diagram, the analysis rarely reflects the complexity of the system.
Rather than using warnings or judgments, your tool includes subtle guidance reminding users to evaluate all cause families and populate multiple plausible contributors where appropriate. This guidance improves rigor without discouraging use.
Depth is encouraged, not enforced mechanically.

Positioning within root cause and corrective action workflows
The cause and effect analysis record is intentionally positioned upstream of final root cause determination. It supports, but does not replace, deeper validation methods such as structured questioning or data analysis.
Once candidate causes are identified and supported, those causes can be tested further and linked to corrective actions and effectiveness verification. This sequencing aligns with how auditors evaluate corrective action processes.
By explicitly stating that root cause determination occurs outside the diagram, the tool reinforces that the Ishikawa diagram is used to identify and organize potential contributing causes rather than to declare conclusions, preventing premature root cause selection and ensuring subsequent analysis such as 5 Whys or corrective action review is based on validated evidence rather than assumption.
In conclusion, clearly separating cause identification from root cause determination strengthens the integrity of the analysis process. The Ishikawa diagram serves as a structured means to explore and organize contributing factors, while definitive root cause selection is reserved for deeper, evidence-based methods conducted outside the diagram. This distinction reduces bias, prevents premature conclusions, and supports corrective actions that are traceable, defensible, and aligned with quality system expectations.
Ronnie Lee Roberts II has worked in the Department of Defense (DoD) quality environment since 2017, supporting programs at Patuxent River and Webster Field (NAWCAD/NAVAIR). A certified AS9100:2016 Rev D Lead Auditor (2022–2025), he brings deep knowledge of quality management systems, documentation control, and audit readiness across aerospace and defense operations. His background includes hands-on experience inspecting to specification per engineering drawings and customer requirements, verifying process conformity, and maintaining compliance with AS9100D clauses related to documented information, product realization, and risk management.
In addition to audit work, Ronnie has supported QMS development, technical writing, CAD-based documentation, and controlled record structures that ensure traceability and repeatability. He also holds ISO/IEC 20000-1:2018 Lead Auditor (TPECS, 2023) and Certified CMMI® Associate (2025) credentials, supporting CMMI-DEV Level 3 environments. His focus remains on aligning documentation and inspection practices with AS9100D standards to drive measurable quality performance and readiness for customer and regulatory audits.